- You are here:
- Home »
- Blog »
- Computer Technician Tools »
- ProcDump – Analyze CPU Spikes

ProcDump – Analyze CPU Spikes
ProcDump is a command-line utility that allows the technician to analyze and diagnose CPU spikes and hanging services. ProcDump also includes hung window and unhandled exception monitoring. The program will write a customized crash dump (.dmp file) based on the technician’s entered parameters. A great feature about ProcDump is that you can automatically set a specific CPU threshold for a process to hit before the program writes a dump file. This means that the program can run unattended and create a dump file at the exact time it causes problems or an abnormal spike.
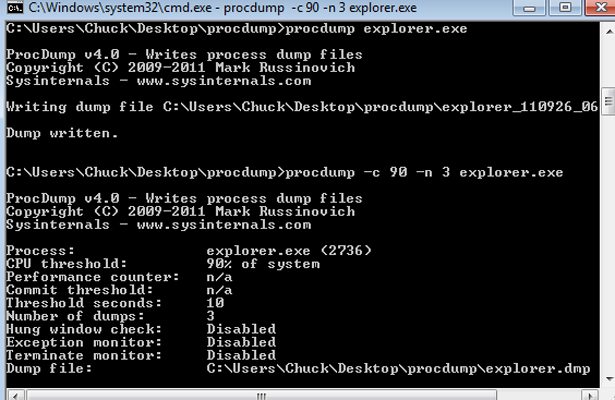
Here’s an example: you notice on a client’s computer that the explorer.exe process spikes the CPU to 90 percent at random times throughout the day, and you’d like to create a few dumps to analyze the problem. Instead of sitting at the computer with task manager open waiting to see a CPU spike, you can enter the following command to create a dump file at three separate times when the CPU for explorer.exe is at or exceeds 90 percent, and then write the dump files to the c:\procdumps directory:
c:\procdump.exe -c 90 -n 3 explorer.exe c:\procdumps
The -c switch is the CPU threshold parameter. The -n switch tells ProcDump how many dump files to create.
You can get more granular in your parameter settings by adding how long a process spikes the CPU before creating a dump file. Example:
c:\procdump.exe -c 90 -s 5 -n 3 explorer.exe c:\procdumps
The -s switch tells ProcDump the length of time the service needs to spike the CPU at the threshold you configured before a dump is created.
Other interesting parameters include “-u” that treats CPU usage relative to a single core, and “-w” which will wait for a specific process to launch if it’s not running.

Download Links
Download from Official Site – 178kb
Download from Brothersoft.com [Mirror] – 178kb
